There are four different methods by which ESX reclaims virtual machine memory. They are:
- Ballooning
- Transparent Page sharing
- Hypervisor swapping
- Memory compression
Ballooning
it is a memory reclamation technique
used by a hypervisor to allow the physical host system to retrieve unused
memory from certain guest virtual
machines (VMs) and share it with others.
VMware memory
ballooning, Microsoft Hyper-V dynamic memory, and the open source KVM balloon process are similar in concept.
Ex: if all the VMs on a host are allocated 8 GB of memory,
some of the VMs only using half of the memory 4 GB. If one VM needs 12 GB of
memory for an intensive process. Memory ballooning allows the host to borrow
that unused memory and allocate it to the VMs with higher memory
demand.
Memory
Ballooning with Real- Time Example
You are running a virtual Machine called ” VM1″ and You are
starting a application called Microsoft Excel on that VM.
Windows will get the memory to run the application from the Guest physical memory.
Hypervisor sees the request and it get the memory from the Host physical memory .
After finish working with the application. Memory which is
used is freed BUT since the hypervisor does not have access to Windows’ “free
memory” list the memory will still be mapped in “host physical memory”
In case of an ESXi host running low on memory the hypervisor
will ask the “balloon” driver installed inside the virtual machine (with VMware
Tools) to “inflate”
In case of an ESXi host running low on memory the hypervisor
will ask the “balloon” driver installed inside the virtual machine (with VMware
Tools) to “inflate”
By default, Balloon driver (vmmemctl.sys)
can reclaim upto a maximum of 65
% of guest physical memory. For example,
You VM is allocated with 1000 MB of memory, It can be reclaimed upto 650 MB
using this technique.
Analyzing Memory Ballooning Statistics:
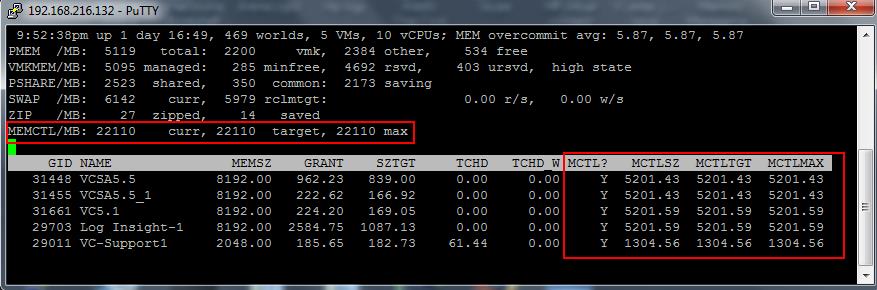
esxtop -> Press m
You will see the “MEMCTL/MB” counter which shows us the overall ballooning activity (22110 MB). The “curr” and “target” values are the accumulated values of the “MCTLSZ” and “MCTLTGT” as described below.

We have to look for the “MCTL” columns to view ballooning activity on a per VM basis:
“MCTL?”: indicates if the balloon driver is active “Y” or not “N”. If VMware tools is not installed or not running this value will show as “N”
“MCTLSZ”: the amount (in MB) of guest physical memory that is actually reclaimed by the balloon driver
“MCTLTGT”: the amount (in MB) of guest physical memory that is going to be reclaimed (targeted memory). If this counter is greater than “MCTLSZ”, the balloon driver inflates causing more memory to be reclaimed. If “MCTLTGT” is less than “MCTLSZ”, then the balloon will deflate. This deflating process runs slowly unless the guest requests memory.
“MCTLMAX”: the maximum amount of guest physical memory that the balloon driver can reclaim. Default is 65% of assigned memory.
Resource Allocation Tab:
You can verify the Memory Ballooning stats of each individual VM from VM Resource Allocation Tab. This particular VM Ballooned value is 5.08 GB

Transparent Page sharing
The main goal of TPS is provid more memory to VM than physical host has. This is called memory over commitment.
TPS is known as memory deduplication
Transparent page sharing is a method by which redundant copies of pages are eliminated.
If the hypervisor identifies identical memory pages on multiple virtual machines (VMs) on a host, it shares them among virtual machines (VMs) with pointers. This frees up memory for new pages. If a VM's information on that shared page changes, the hypervisor writes the memory to a new page and readdresses a pointer.
In short ,Identical memory can be shared among VM
How does it work?
The memory is split in 4 KB pages. Windows
Virtual machines might have identical memory pages. TPS runs every 60 minute .It
scans all memory pages and create a HASH
value for each of them.
Those hashes are saved global hash table
and then it compared to each other by kernel. Every time the ESX kernel finds
two identical hashes the kernel leaves only one copy of page in memory and
removes the second one.
when one of your Virtual machine requests to write
to the page, VMkernel creates a new page and new page access will only be
provided to that particular virtual machine. This terminology is called Copy-on
Write (COW).
You can verify the memory which are
shared using Transparent memory Sharing (TPS) from Esxtop ,Virtual Machine
Resource Allocation tab and also using vCenter Performance Graphs.
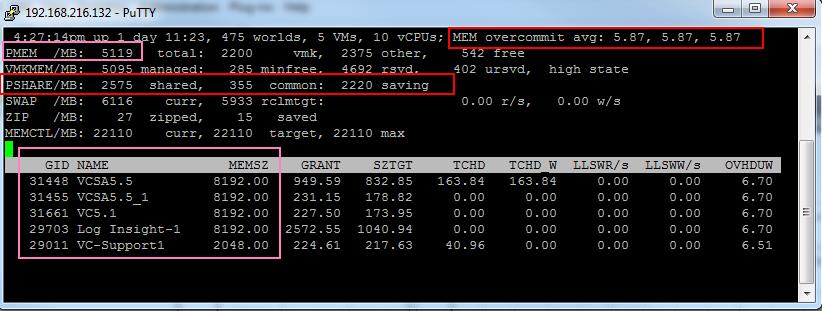
esxtop -> Press m
You will be able to see how much %
of memory is overcommited in your ESXi host using the Value MEM Overcommit
avg. The MEM overcommit avg tells us that the average memory
over commitment level averages in 1-min, 5-min and 15-min. A value of 0.50 is a
50% over commitment of memory. In our case it is 5.87 which is nothing but 587%
memory over commitment on my host. My ESXi host is having 5 GB of memory with 5
Virtual Machines. Out 5, 4 VM’s are allocated with 8 GB and 1 VM alloacted with
2 GB of memory. My total ESXi memory is 5 Gb but allocated memory for Virtual
machines is 34 GB. which is almost 7 times the available memory of my ESXi host.
This over commitment becomes only possible because of this VMware Memory
management techniques.
Detailed stats about Memory saving
using Transparent page sharing can be found with PSHARE value. Take a
look at PSHARE/MB 2575 MB which is shared between the Virtual machines
out of which 355 MB is common. Which allows us to save 2220 MB of memory using
Transparent Page sharing.

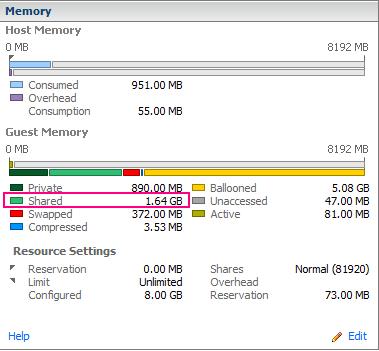
Memory which are shared at
individual Virtual Machines can also be viewed using the resource allocation
tab of each virtual machines. Below Virtual machine is having around shared
memory of around 1.64 GB. which is the Amount of guest “physical” memory
shared with other virtual machines using the transparent page-sharing
mechanism.

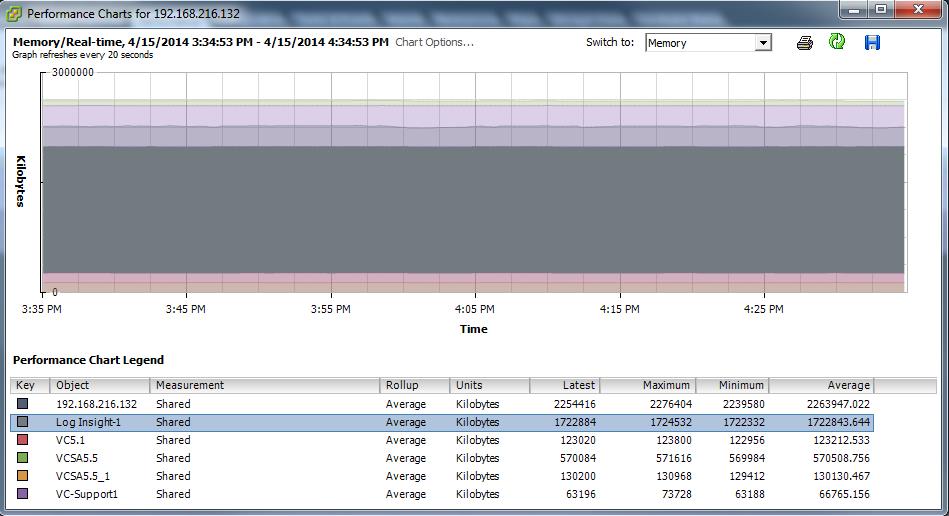
You can also use vCenter Performance
graphs to collect the Shared memory stats of each Virtual Machine on the ESXi
host using the shared stats under Memory in vCenter Advanced chart options.
Shared Common is the Amount of
machine memory that is shared by all powered-on virtual machines and vSphere
services on the host.
shared – sharedcommon
= machine memory (host memory) savings (KB)
2575 Mb – 355MB = 2220
MB host memory saving

Memory Compression:
In simple the when memory contention happens, the memory pages which is about to swapped will be compressed and store in the main memory instead of disk.
Memory compression outperforms swapping because the data accessed from the main memory than the disk
The compression ratio should always less than 50%
Hypervisor Swapping
In the cases where Ballooning (and
TPS) are not sufficient to reclaim memory, ESX employs Hypervisor Swapping to
reclaim memory. At guest startup, the hypervisor creates a separate swap
file for the guest. This file located in the guest’s home directory has an
extension .vswp. Then, if necessary, the hypervisor can directly swap
out guest physical memory to that swap file, which frees host physical memory
for other guests. The swap file size is set to the guest physical memory minus
its Reservation. For example, if you allocated 4GB to a guest and set a
Reservation of 1GB, the swap file size will be 3GB